In the quest to lower your golf scores, putting can often make the difference between a great round and a frustrating one. One of the most effective tools to refine your putting skills is the green heat map. This technology provides valuable insights into how your putts are performing on the green, helping you make informed adjustments to your technique and strategy. In this guide, we’ll explore what green heat maps are, how they work, and how you can use them to enhance your putting performance.
What Are Green Heat Maps?
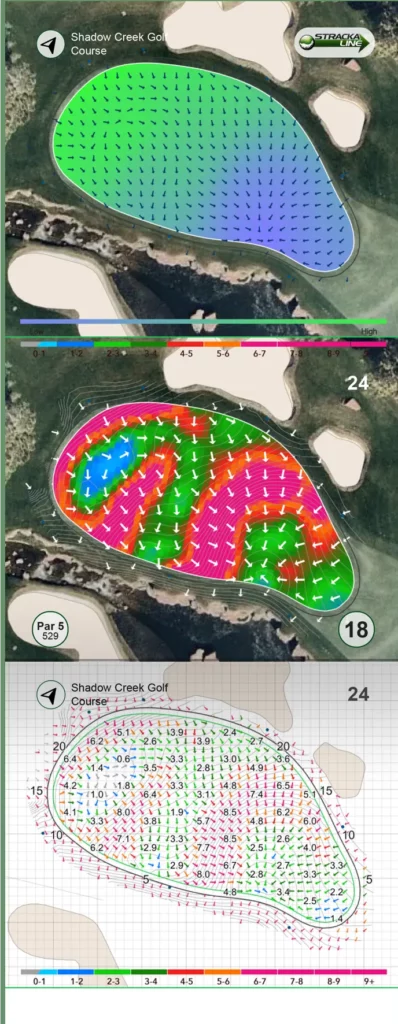
Green heat maps are visual representations of putting statistics that show the performance of your putts across different areas of the green. They use color-coding to indicate various aspects of putting performance, such as distance from the hole, break patterns, and consistency. Typically, green heat maps are generated through advanced golf technology, including launch monitors and GPS devices, which track your shots and compile data into easy-to-understand visual formats.
How Do Green Heat Maps Work?
Green heat maps collect and analyze data from your putts to create a detailed overview of your performance. Here’s how they work:
- Data Collection: Advanced golf technology tracks each putt you make during a round or practice session. This data includes the distance, direction, and accuracy of each putt.
- Data Analysis: The collected data is then processed and analyzed to identify patterns and trends. This analysis helps in understanding how well you’re performing on different parts of the green.
- Heat Map Visualization: The analyzed data is visualized in a heat map format. Colors on the map represent different levels of performance—typically, warmer colors (like red or orange) indicate areas where your putting performance is less effective, while cooler colors (like blue or green) represent areas where you’re performing well.
Benefits of Using Green Heat Maps
1. Identify Weak Spots Green heat maps allow you to pinpoint areas of the green where your putting needs improvement. By analyzing the heat map, you can identify specific regions where you consistently miss the mark and focus your practice efforts on these areas.
2. Improve Distance Control By visualizing your putts’ performance across different distances, green heat maps help you understand how well you’re controlling distance on the green. This information is crucial for adjusting your putting technique to achieve better distance control.
3. Enhance Green Reading Skills Green heat maps can also help improve your green reading skills. By analyzing the break patterns and how you perform on different slopes, you can develop a better understanding of how to read greens and adjust your putting strategy accordingly.
4. Track Progress Over Time Using green heat maps over time allows you to track your progress and see how your putting performance improves with practice. This ongoing analysis helps you stay motivated and make necessary adjustments to your practice routine.
How to Use Green Heat Maps Effectively
1. Analyze Performance After Each Round Review your green heat map after each round to understand your performance. Look for patterns in the data and focus on areas where your putting can be improved.
2. Incorporate Targeted Practice Use the insights from your heat map to create targeted practice sessions. Focus on practicing putts from areas where your performance is lacking and work on improving your distance control and accuracy.
3. Adjust Your Putting Technique Based on the data from your heat map, make adjustments to your putting technique. This might include altering your stance, grip, or stroke to address specific weaknesses identified in the heat map.
4. Combine with Other Data Combine green heat map data with other performance metrics, such as stroke statistics and putting drills, to get a comprehensive view of your putting performance and areas for improvement.
Conclusion
Green heat maps are a powerful tool for golfers looking to improve their putting skills and overall performance on the green. By providing detailed insights into your putting data, they help you identify weaknesses, refine your technique, and track progress over time. Incorporate green heat maps into your practice routine, and you’ll be well on your way to making more putts and lowering your scores.
Ready to take your putting to the next level? Explore green heat maps and see how this technology can enhance your game!
Discover more from Ten to Scratch
Subscribe to get the latest posts sent to your email.